Project Motivation
“To transform the world, help people, lift others up, change lives.” ― Matshona Dhliwayo
Modern global dynamics shift rapidly due to continuous geopolitical change in political, social, and diplomatic spheres. To enable positive development, there is a need to ensure all countries have equal opportunity to be informed on their weaknesses and strengths. Our approach is to understand what makes countries underdeveloped, what makes countries exceptionally developed, and understand the underlying geopolitical reasons and trends among countries that classify them as such. This will allow us to compare underdeveloped countries to exceptionally developed countries to inform international policy.
Methods
The primary method used to analyze and visualize the dataset was K-Means clustering. K-Means clustering is a method of vector quantization that aims to partition observations/data points into k clusters in which each observation/data point belongs to the cluster with the nearest mean. Our group decided that this was the best method to gain an understanding of the dataset and its trends. To determine the best number of clusters to use for K-Means, we used the elbow method, which allowed us to understand the best trade-off between groupings and loss.
Algorithmic Outline of K-Means
Given an initial set of k centroids, the algorithm repeats the following process for a pre-determined amount of iterations or until convergence is reached:
-
Assignment Step: First, assign each observation/data point to the cluster with the nearest mean. This can be calculated using a variety of different techniques, but the most common one (and the one we used) is establishing distance from point to center by using Euclidean distance.
-
Update Step: After assigning each observation/data point to a cluster, recalculate the centroids based on the assignment step.
Ultimately, we try to optimize the objective function for K-Means which is:

Dataset
The dataset that we used for this project is sourced from Kaggle. It is a dataset composed of 65 indices on countries around the world, primarily taken from the World Bank, UNICEF, NATO, and other reputable sources. Indices include Gross Domestic Product, Human Development Index, GINI coefficient, and other economic and social indicators for each country. The dataset creators note that data that is not available is estimated using a kNN approach. Furthermore, it should be noted that some of these indices are self-reported from the countries of interest. It’s well known that several countries in this dataset do not accurately report statistics that reflect the true state of the country, however, most of the data comes from third-party, unbiased sources that seek to improve the world for its citizens.
Key Indicators and Terms
There are some important global indicators that are used in our dataset that are relevant to point out:
-
Human Development Index (HDI): HDI is a measurement of human development, often framed in terms of whether people are able to “be” and “do” desirable things in life. Examples include being well fed, having shelter, being healthy, as well as having the ability to do work, have education, and participate in voting. A country scores a higher HDI when expected lifespan is higher, the mean education level is higher, and the gross national income GNI (PPP) per capita is higher.
-
GINI: The GINI coefficient is a measure of statistical dispersion intended to represent the income or wealth distribution of a nation’s residents, and is the most commonly used measurement of inequality. A higher GINI coefficient indicates a higher disparity in income distribution.
-
Gross Domestic Product (GDP): The OECD defines GDP as “an aggregate measure of production equal to the sum of the gross values added of all resident and institutional units engaged in production and services (plus any taxes, and minus any subsidies, on products not included in the value of their outputs).” GDP is essential in measuring a country’s economic power.
Visualization
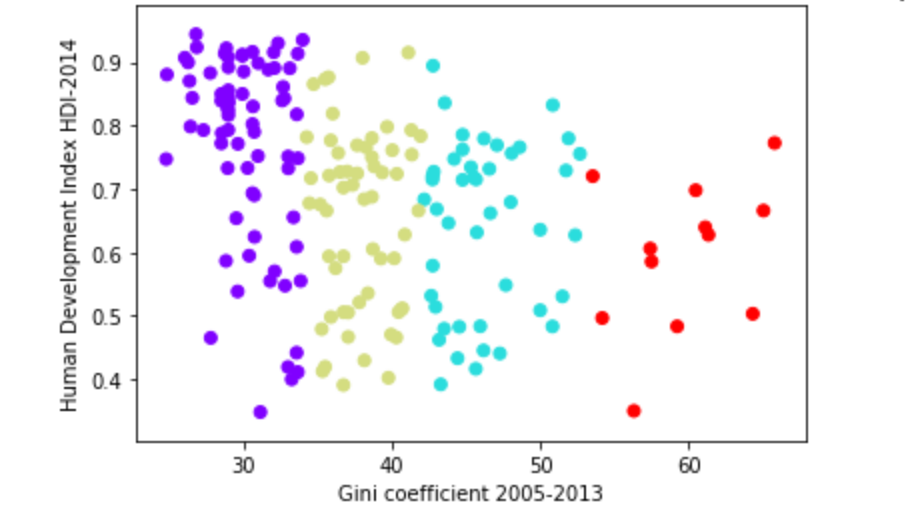 Figure 1: GINI coefficient vs. Human Development Index
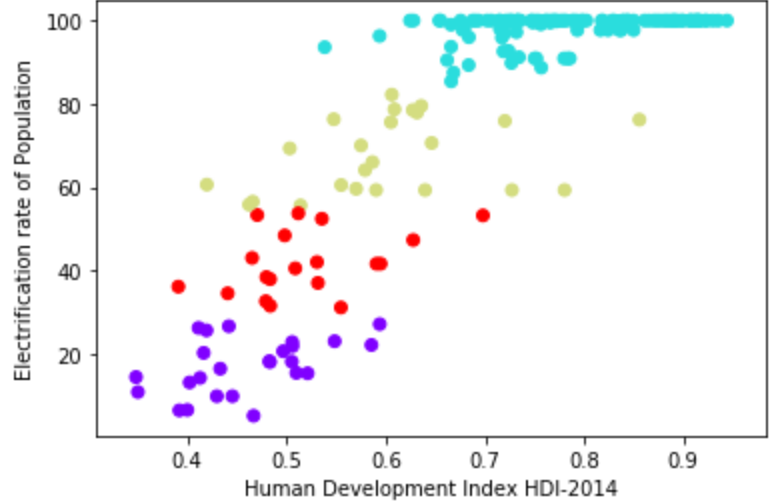 Figure 2: HDI vs. % of population that have electricity
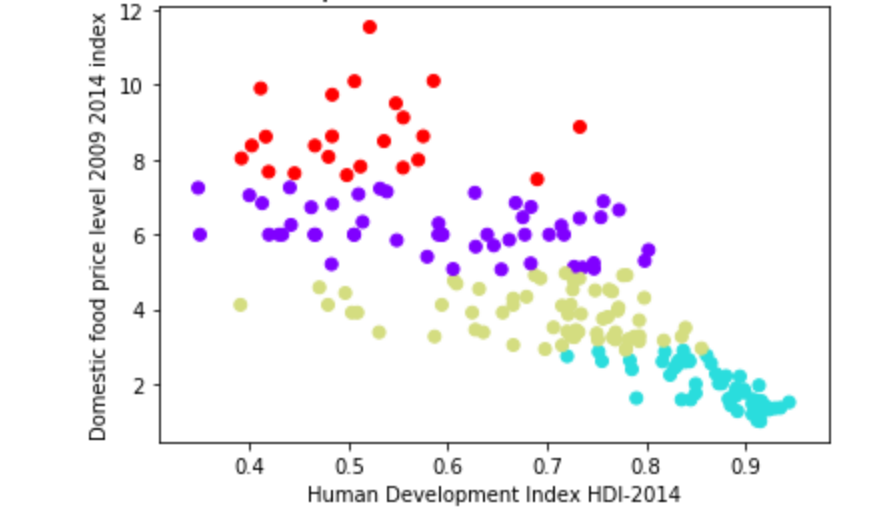 Figure 3: Human Development Index vs. Domestic Food Price Index
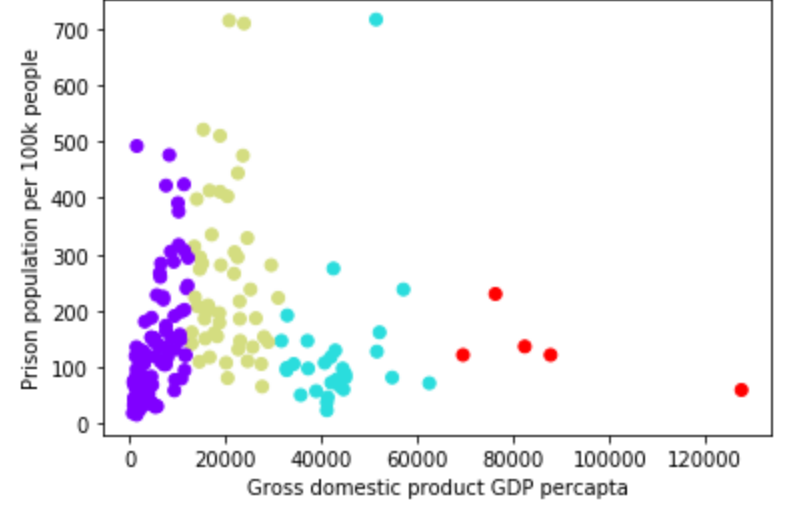 Figure 4: GDP Per Capita (in USD) vs. Prison Population of Every 100k Persons
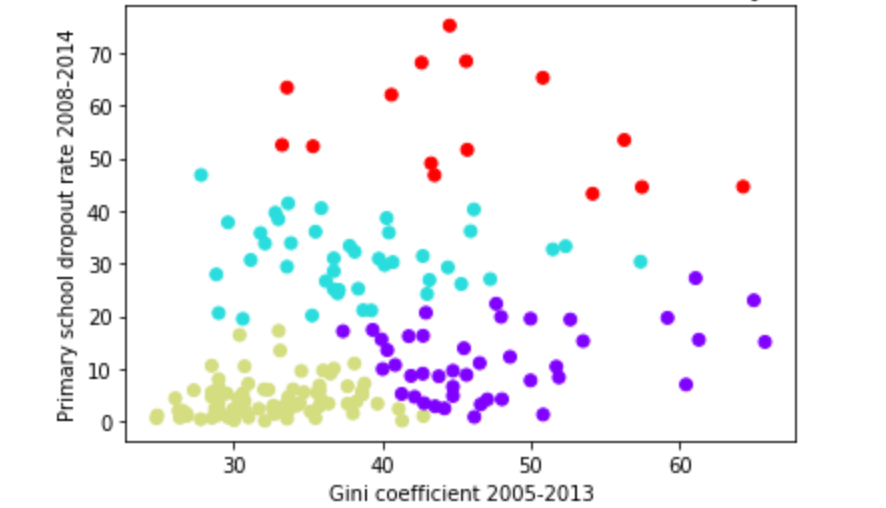 Figure 5: GINI coefficient vs. Primary School Dropout Rate
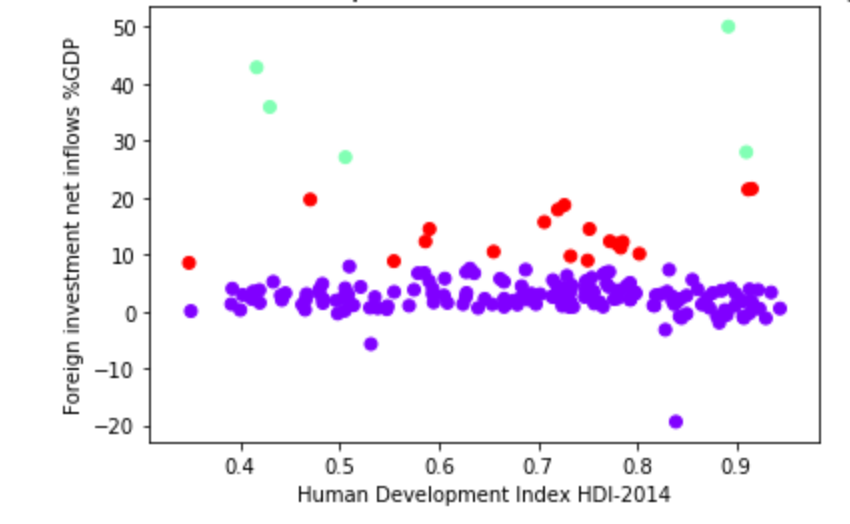 Figure 6: Human Development Index vs. Foreign Investment into Country as % of GDP
Discussion
“Not everything that is faced can be changed, but nothing can be changed until it is faced.” -James Baldwin
We split our analysis and discussion of the most interesting clusterings, into 4 categories: Access to Resources, Social and Domestic Policy, Education, and Commitment to Globalization. To begin, we look at the very first figure. In Figure 1, we clustered together the GINI coefficient along with each countries’ Human Development Index. It is important to note that these two measures are independent and the factors that contribute to their scores are not directly related. Looking at the left most clustering in Figure 1, colored in purple, these grouped countries have the lowest GINI scores. This indicates that these countries have the lowest wealth/social inequality, indicating close to, if not equal, opportunity for social mobility for citizens of that country. There may be some evidence of social stratification, but citizens of lower social-economic classes generally can improve their position within the society. Human development thrives in countries in which each citizen is afforded the proper opportunity to advance and succeed.
Access to Resources
People and countries alike cannot be successful or wealthy if they do not have access to even fundamental resources. In figures 2 and 3, we look at how human development is affected by access, or lack thereof, to fundamental resources, in particular, food and electricity. In figure 2, we clustered together HDI and percentage of a given country’s population access to electricity. There are clear groupings and a clear trend between HDI and how much of the population has access to electricity. Looking at the bottom left clustering (in purple), these countries are all located on the African continent. It’s well known that the African continent is plagued with social and economic mobility due to lack of resources, war and internal violence, and other factors. African nations do not have the ability to build and support the infrastructure needed to give electricity to all of their citizens, which causes for perpetual lack of human development. On the other hand, the countries that populate the cluster with high HDI and 100% electrification are the countries most people would expect - most of the Western world, as well as a majority of Asian countries. Electricity powers much of modern day life, including tools that make daily life even possible. Figure 3 clusters domestic food prices with HDI. The domestic food price index is a metric that directly compares the price level of food to that of other goods that consumers face. Similarly, countries in the red grouping are mostly African countries. Given their lack of access to basic resources like electricity (and water!), these countries do not have the economic power to meet their demand of food, consequently driving up the price of food items. With raging inflation in these countries, wondering where their next meal is going to come from is a daily question many citizens of these countries ask themselves. Therefore, as can be expected, dependable access to fundamental resources is a major contributing factor to HDI.
Social and Domestic Policy
GDP per capita is a great indicator of the standard of living, and by consequence, a great indicator of how the propserity of the country benefits the average citizen. Figure 4 clusters GDP per capita and the prison population per 100k citizens. It’s commonly accepted that education and prison population are generally negatively correlated. We couldn’t agree more! But are there more factors that could contribute to the prison population of a given country? We argue that it’s statistically more likely for a particular country to have a higher prison population, if the GDP per capita is low. If the average citizen of a given country struggles to get by on a daily basis, it only make sense that they will do what is necessary for their survival, which in most terms, means turning to crime or breaking laws. Our clustering mostly supports this hypothesis. However, we’d like to point a particular point on the graph. There is an outlying blue point that sits at about (55,000, 700) - that’s the USA! The USA contains about 4.5% of the world’s population but accounts for about 25% of the world’s incarcerated population. The United States is one of the most prosperous countries in the world, so why is the prison population so high? Experts believe that it’s because of the domestic policy the USA maintains. The USA maintains some of the strictest prison sentences among its peer nations, making it stand out along the top nations in terms of HDI. Furthermore, experts agree that if the USA reformed its domestic policy on prison sentences, it could produce profound benefits for its economy as reformed prisoners could bring extraordinary benefits.
Social and domestic policy also refers to those who maintains the government for each of these countries. Countries clustered in the purple group, for the most part, are within the African continent - a region of the world plagued with economic, political, and social upheaval. Many countries and NGOs have given foreign aid to many of these countries in the purple cluster (i.e. Central African Republic, Somalia, DRC, etc.) but these countries are extremely corrupt so most of the foreign aid doesn’t go to the benefit of the citizens of the country, nor the development of infrastructure, schools, etc. Many efforts have been undertaken to root out these corrupt governments, but the problems still persist today.
Below is an interactive map that shows the perceived corruption in the world, produced annually by Transparency International. You can read more about it here.
Education
Figure 5 clusters countries based on its GINI coefficient and primary school dropout rate. We focus on the red clustering, indicating high primary school dropout rate and a range of GINI values. All of these countries are located on the African continent. Most children in these African countries are not guaranteed education by their country, due to lack of resources. Only the most priviledged children (countries with high GINI scores) are allowed to attend school beyond primary school, as further education is not affordable by the general population. It’s important to note that some of these African countries have low GINI scores because everyone is equally disadvantaged - an example is Somalia. Somalia is considered a failed state by the UN, but has a lower GINI score than the USA, but has a literacy rate of 37.8% (CIA World Factbook). Another key cluster is the green cluster. Almost all developed and equal countries, located in this cluster, have very low primary school dropout rates, as mostly everyone is afforded the same fundamental right to education. Bottom line: education is one of the greatest social equalizers and one of the greatest factors for a country’s prosperity.
Commitment to Globalization
Figure 6 clusters countries by incoming foreign investment as a percentage of GDP. The purple cluster is the cluster of countries that receive between 0 and 10 percent of their GDP (average is 1.4%) in foregin investment or give the more investments they receive (-20 to 0% of GDP). Green dots indicate countries that are receiving relatively high foreign investment as a percentage of their GDP. Almost every single country that has been identified as underdeveloped (HDI below 0.4) are in the purple cluster; European and Asian countries dominate the majority of the red and green clusters (countries receiving a substantial amount of foreign investment). There is an astounding lack of investment in developing countries - as a globalizing economy, there should be a stronger commitment to all international markets.
Conclusions
We set out to use K-Means clustering to analyze world data to understand trends that make or break countries. We do not intend to suggest policy but rather illuminate perennial problems in countries that continue to struggle. We identified 4 common trends that seem to continually challenge underdeveloped countries - those same trends strengthen the most developed countries. In an effort to prevent further stratification and to promote a more connected, globalized world concerned about each and every human, we suggest focusing on the following: Access to Resources, Social and Domestic Policy (in particular, government corruption and citizen imprisonment), Education, and Commitments to Globalization. A well-developed country should ensure its citizens have access to basic fundamental resources (electricity, food), should strive to have equitable social and domestic policies that benefit every citizen, should ensure all citizens have an equal opportunity to receive an education, and should further contribute to the world so that other countries may prosper. Global development is a grandiose challenge that continues to perplex even the most developed countries; but it’s a challenge that will continually improve the human condition.
Contributing Members:
- Grant Champagne
- Nick Cich
- Brando De Courten
- Alexander George-Kennedy
- Zack Vogel